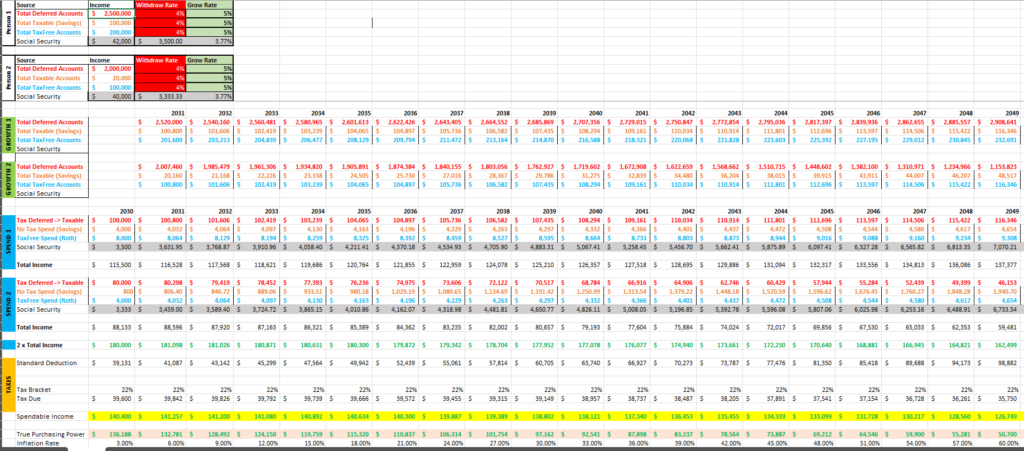
A while ago, I wrote a five step retirement plan that culminated in putting all the steps together here. The net result of all of that work was the creation of a spreadsheet to show us how our retirement money flows might pan out.
I am still working on tweaking the spreadsheet and there are many variables to deal with but I think it provides at least a decent view into what our future might look like under some assumptions.
Spreadsheet Scenarios

The image above is a little busy so I created another image below that got to the bottom line. I include the image above so you understand the complexity. We are a married couple and have dual incomes, dual money pools, dual retirement plans and we’ll both need to deal with taxes together.
5 Percent Growth, 4 Percent Draw, 3 Percent Inflation
You can see some assumptions such as a 5% growth rate of our portfolio and a 4% draw which may seem very conservative to many but the point of the spreadsheet is to change scenarios. The money pool is based on what we have today not what we will have in 7 years and doesn’t include rental property income and any future income we are currently working on such as a side business, changes to salary, etc.

Above is a simplified image and the greatest concern we have is INFLATION. For example, based on the assumptions we made, in the year 2045, we’ll be able to draw $133,000 in retirement funds, sounds great right? Well the true purchasing power of $133k in 2045 is going to be $69,212 based on 3% inflation.
8 Percent Growth, 4 Percent Draw, 3 Percent Inflation
So what if our portfolio grows at 8 percent instead of 5 percent?

If we change just ONE variable, the growth rate of our portfolio from 5 percent to 8 percent, our spendable income in 2045 is now $198,667 with a purchasing power of $103,307 based on 3% inflation. Well feels a whole lot better but how can we guarantee we grow at 8 percent? More importantly, how can we assure inflation will stay at 3 percent or less?
8 Percent Growth, 4 Percent Draw, 4 Percent Inflation
What happens if inflation is 4 percent and our portfolio grows at 8 percent?

At 4 percent inflation AND 8 percent portfolio growth, our income in 2045 stays the same at $198,667 but the purchasing power of that money is down to $71,520 in 2045. The effect of INFLATION is terrible which makes the case for why “EARN MORE THAN YOU SPEND” is better than “spend less than you earn.” During our retirement, we may be on fixed income so if we continuously focus on spending less than we earn then we’ll be poorer and poorer given all things remain equal.
Fortunately, we made the decision to get into rental properties so if there is inflation we will be able to pass on those inflated costs to our renters and capture that income as part of our retirement. That’s not included in the spreadsheet because it makes it far more complicated and we’re not trying to calculate our future down to the last penny.
What About Taxes?
The calculations in the spreadsheet have us staying between 22% and 24% tax brackets and if we add rental income, it will likely push us even higher but we simply don’t know what the future tax brackets will be and have to assume what we know today but do suspect we will have much higher taxation in the future. The spreadsheet does allow us to play around with tax brackets too.
What About Losses?
There is a risk that our portfolio takes some losses too so we can always adjust our pool of money but that’s the great thing about the spreadsheet, it always us to change the scenarios over time.
Conclusion
I will continue to tweak the spreadsheet and while it’s not perfect, it has given us a peek into our future and that future seems ok under some scenarios and outright terrifying under others.


1 thought on “Update On Retirement Planning Spreadsheet”
Comments are closed.