

I think the stock market, in general, is very over-valued but that doesn’t mean there isn’t value in the market. I have a methodology I use to find the best stocks for me to invest in but before we get to that let’s cover a few topics.
Free Cash Flow
The best valuation method for any stock has been proven to be the Free Cash Flow Yield (FCF). If you want to learn about FCF, you can start here at Investopedia. There are many valuation methods including P/E, the position of the planets, chicken bones, tea leaves, and many others but FCF has proven, at least for the last decade, to be the best indicator of the growth of a stock.
How To Find Stocks
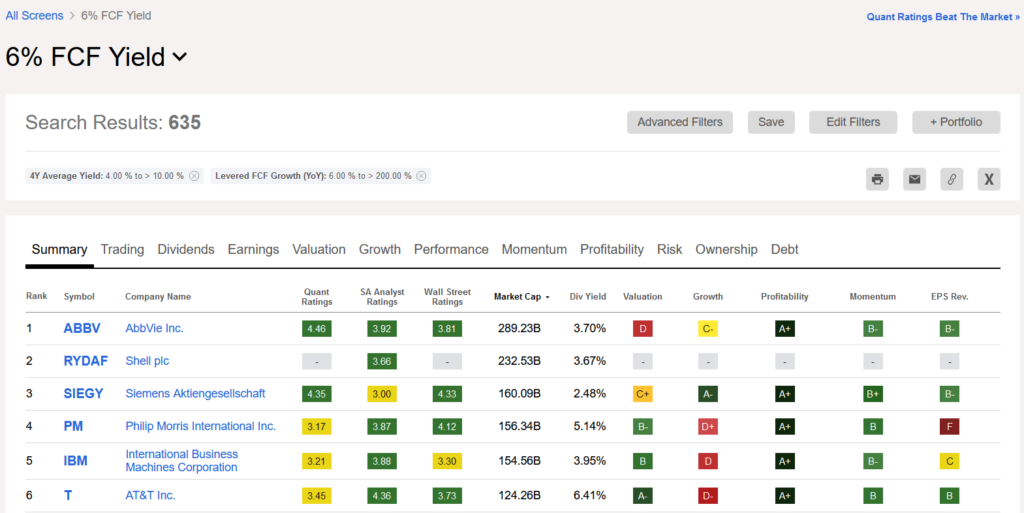
So now that you know I use FCF as a key metric for stocks, how do you find them? You will need to use a stock screener from somewhere like finance.yahoo.com, seekingalpha.com or some other website that has screening capabilities. Most brokerage firms have their own stock screeners too but I like to use Seeking Alpha because it’s easier to read and use. Below is a sample image of a search for stocks with 6 percent levered Free Cash Flow and that pay a 3 percent dividend or higher.
S&P 500
As you can see, there are 635 stocks in that list and that’s quite a bit to filter through except I have other criteria and Seeking Alpha doesn’t make it easy to do this so I usually download this into excel. I have a conditional formatting in an Excel spreadsheet that compares these list with a current list of the stocks in the S&P 500 and I only select those from the long list that are also members of the S&P 500.
Why? Because most people that invest simply buy index funds like the S&P 500 (SPY) and let it ride which means every time someone gets paid and they are automatically investing their 401k’s or other investments, money automatically flows into these stocks each and every month.
Fast Graphs
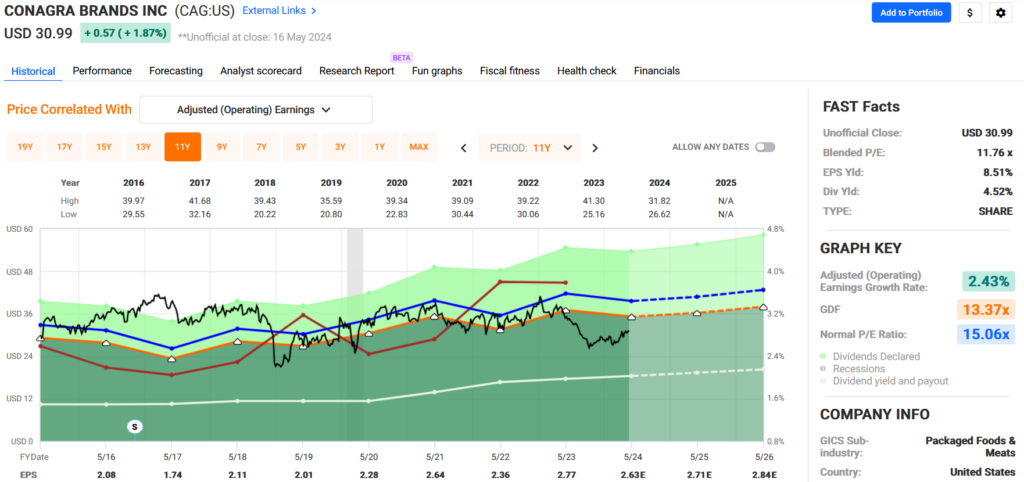
After matching the FCF + S&P 500 lists I upload that filtered stock list to FastGraphs and do some more research to check valuations using graphs instead of tedious numbers and spreadsheets to review the data. Below is a screen shot of Conagra Brands (CAG) and it shows it’s in a historically value stage at the moment.
You can watch Chuck Carnevale’s videos here to get an idea of how to use the FastGraphs tool.
It is important to note that both Seeking Alpha and FastGraphs require paid subscriptions and in my opinion are worth the money since both save a tremendous amount of time and effort from doing this research manually.
After doing my research I create a watch list and an activity for the stocks I like. Below is a screen shot of my current list.
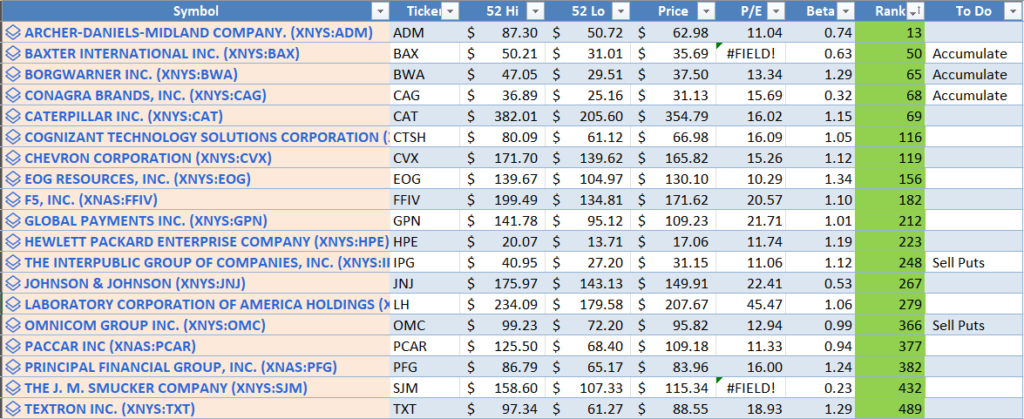
I’ve started very small positions in the stocks with the “accumulate” label and will likely sell puts on the ones labeled “sell puts” on my list and watch the others for declines and a right entry point. I should note that these particular stocks are for my TAX DEFERRED bucket of money. It is important to buy the right stocks for the right bucket of money to avoid excessive taxation.
Running through this process periodically takes time and there are other tools I use to refine my stock picking but I’ll leave those for another post and another day. This is one of the reasons why I don’t have time to waste watching football because I’d rather focus on my investments.
I have methodical processes for ETFs, real estate, bonds, and other investments and I will hopefully have time to write those posts soon or maybe I’ll sit on my recliner drinking beer and watching football. Which would you prefer?
Share The Wealth
What methodologies do you use to find stocks?