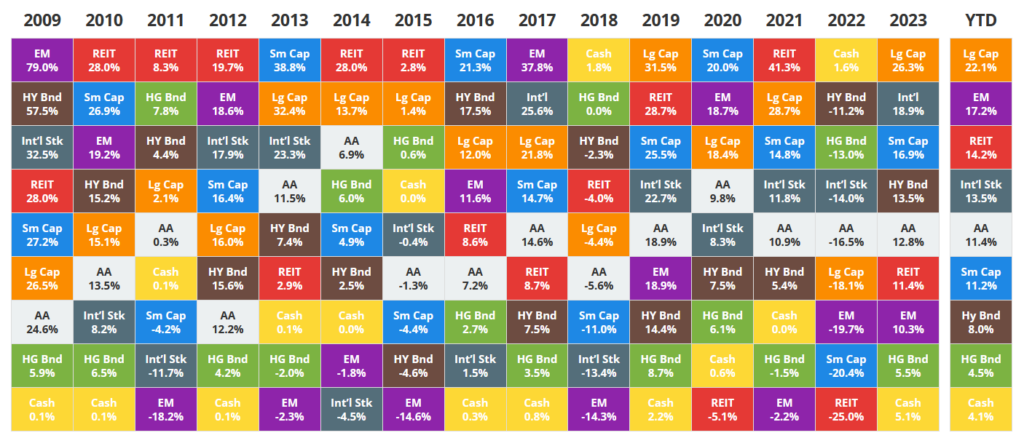
Here’s another quick and amazing way to analyze data with AI. I visited this website and found the chart below. I wanted to know quickly which asset class had the best returns during the time period. Normally I would type the data into excel and start running averages but I decided to let AI do the heavy lifting.

I wanted to know which asset classes provided the best returns during the time period.
Top Three:
Large Cap (Lg Cap): 14.18% average return
Small Cap (Sm Cap): 11.84% average return
REIT (Real Estate Investment Trusts): 11.50% average return
Bottom three:
Cash: 0.58% average return
High Grade Bonds (HG Bnd): 3.99% average return
Asset Allocation (AA): 7.62% average return
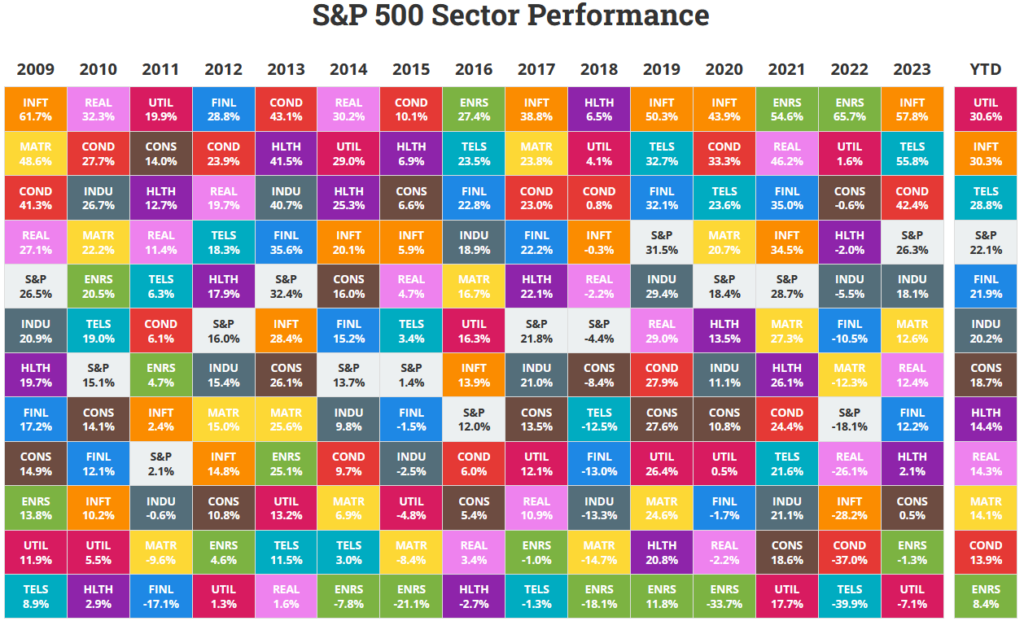
I next asked AI to review this image and tell me what the average returns were as well.

Sector Returns 2009 – 2023
| Sector | Returns |
|---|---|
| INFT | 22.75 |
| ENRS | 20.21 |
| COND | 18.88 |
| TELS | 16.49 |
| REAL | 15.22 |
| S&P | 14.87 |
| HLTH | 14.81 |
| FINL | 14.20 |
| UTIL | 12.95 |
| MATR | 12.84 |
| INDU | 12.79 |
You may have noticed if you clicked on the link that there are tables with the information below and they don’t actually match what AI computed nor do they match what I computed so there is a bit of a mystery how the computations are being done but the rankings of returns was correct.
Finally, I asked AI what the lowest expense and highest liquidity large cap ETFs were and AI stumbled on this response. It was clearly searching ETFDB.com and ETF.com for the information because it displayed links to the information. It suggested SPY and VOO which were technically correct answers but also suggested SCHX and ITOT.
Share The Wealth
What do you think of AI’s prowess so far? Let me know in the comments below.


1 thought on “AI: Analyzing Asset Class & Sector Performance Returns With AI”
Comments are closed.